
The market capitalization of the world’s 100 largest public companies has increased by US $1,040 billion (5%) in 12 months to a record US$21 trillion, according to PwC’s Global Top 100 ranking.
The rise is more subdued than the 15% increase reported in 2018, reflecting more challenging market conditions, PwC said.
Growth in market capitalization in the past year has been primarily driven by US companies, on the back of a robust economic environment.
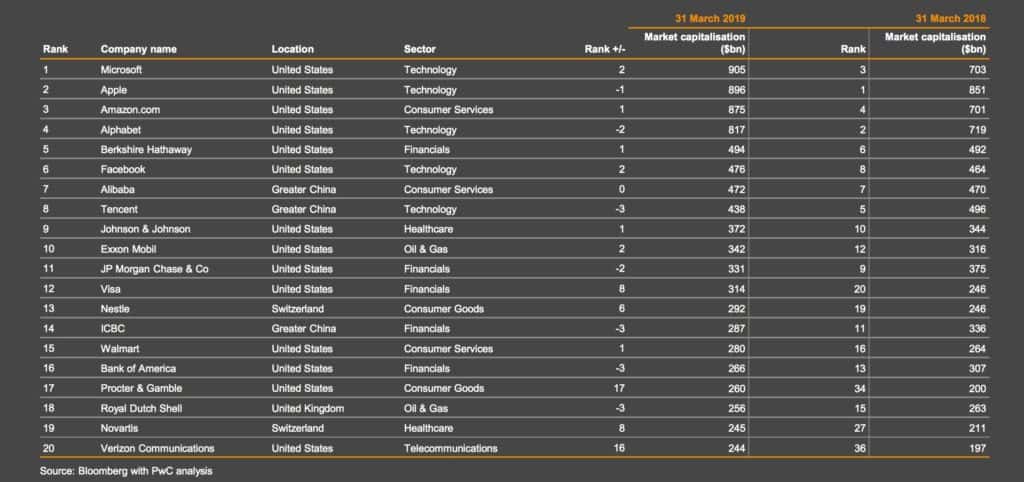
The 20 largest public companies by market cap
Both Greater China (-4%) and Europe (-5%) registered a decrease in market capitalization, reversing last year’s gains, the report reveals.
Tech continues to dominate
The technology sector continues to dominate, although the healthcare, consumer services and telecommunications sectors performed most strongly over the past year.
For the fifth year running, the US accounts for more than half (54) of the Global Top 100 by number of companies with growth of 9%, the company pointed out.
US companies represent 63% of the total market capitalization, up from 61% last year.
Greater China is the second largest component of the Global Top 100 by market capitalization, despite a 4% decline in the past 12 months following trade uncertainties and their impact on local market sentiment.
This contrasts with the 57% increase in 2018, when three new companies entered the Global Top 100 and two rose to the top ten.
India: The best performing country
Overall, the best performing country in the ranking in relative terms was India, PwC noted.
Despite having only two companies in the Global Top 100, a strong domestic stock market performance and robust earnings increased their market capitalization by US$63 billion or 37%, the firm said.
“While the US continues to be the powerhouse of the Global Top 100, we expect to see a growing contribution from China, India and other developing markets. The new entrants from India and Saudi Arabia this year, and strong growth in the value of companies from the rest of the world support this view,” said Ross Hunter, Partner and IPO Centre Leader, PwC UK.
Financials the weakest sector
The technology sector continues to be the largest component of market capitalization within the Global Top 100, ahead of the financials sector, with healthcare in third place.
Growth in the healthcare, consumer services and telecommunications sectors of 15% outpaced technology’s growth (6%), which experienced volatility in late 2018.
Financials was the weakest performing sector with a 3% decline in market capitalization.
The global top ten continues to be dominated by the technology and e-commerce companies – Microsoft, Apple, Amazon, Alphabet – followed by Facebook in sixth position and Alibaba and Tencent as numbers seven and eight, respectively.
Microsoft was the strongest performer in terms of absolute increase in market capitalization, gaining $202 billion or 29% in value compared to 2018, which propelled it into the top spot.
It’s followed by Apple, Amazon and Alphabet.
This breakaway group is 40% ahead of the fifth ranked company, Berkshire Hathaway, which has a market capitalization of US$494 billion.
Growth of the 100 unicorns
In the private company domain, the value of the top 100 unicorns grew by 6% to US$815 billion at Mar 31, 2019, consistent with their public company counterparts.
Nearly half (48%) of the top 100 unicorns were from the US, also in line with what we see in the Global Top 100.
Greater China contributes approximately 30% of unicorns in both number and value terms, which is a much higher proportion than for the Global Top 100.
As a significant source of future IPOs or acquisitions by other companies, this suggests that we can anticipate more entries from Greater China into the Global Top 100 in due course.
Challenge from Greater China
While the technology sector didn’t perform as strongly as in previous years, it continues to dominate the Global Top 100, with the top four US giants in a league of their own, said Ross Hunter, Partner and IPO Centre Leader, PwC UK .
“But in the longer term, we anticipate the imbalance reducing, with Greater China technology companies, in particular, challenging the current position,” he predicted. “The prominence of companies from Greater China amongst the unicorns may be evidence to support this.”